Customer onboarding toolkit

By
Avaran

Why Customer Churn Starts at Customer Onboarding: And How to Reduce Customer Churn Before It's Too Late
"The seeds of churn are planted early."
— Lincoln Murphy
Research shows that 40–60% of new SaaS users abandon a product after the first use, often during onboarding. In fact, over 60% of users drop off during onboarding if they don’t quickly understand the product’s value. This highlights how critical early engagement is for retention.
You've seen this pattern before.
The enterprise deal closes. B2B Onboarding wraps on time. Every checkpoint gets checked. The account status glows green across your dashboard.
Then, six months later, the renewal conversation goes sideways. Three months after that, customer churn happens.
Nothing obviously broke. No escalations. No missed milestones.
But somewhere between "deal closed" and churn, something critical never landed, and your customer churn rate quietly climbed.
For CS leaders, this gap is your most expensive blind spot. Not the customers who complain loudly, but the ones who go quiet while confidence erodes.
This is the anatomy of that gap, and the tactical playbook to calculate churn risk early and prevent customer attrition before it's inevitable.
Related Blog: Personalize Customer Onboarding Experience at Scale with AI
Understanding Customer Churn: The Hidden Problem in "Successful" Onboarding
Here's what a "successful" enterprise onboarding looked like:
Multi-year contract, executive sponsor identified
Clear implementation timeline with milestones
Product live in 45 days
Onboarding formally closed and handed to CS
No customer support escalations, no delivery delays
Every internal system said: mission accomplished.
But no dashboard captured how the existing customer actually felt.
Because completion status doesn't measure confidence. Usage metrics don't measure belief. And belief drives customer retention, expansions, and advocacy, the foundations that prevent customer churn.
The True Cost of Customer Churn
Acquiring a new customer costs 5-25x more than keeping an existing customer. A new customer can cost your business significantly more in resources, time, and opportunity costs.
Quick math on a $100K ARR customer:
Customer acquisition costs: $15,000-$30,000
Onboarding investment: $5,000-$10,000
Total sunk cost: $20,000-$40,000
Lost lifetime value (3-year contract): $300,000
One preventable churn = $340,000 total impact.
Understanding what customer churn is and why churn happens is the first step toward building a stronger customer base.
The Projetly difference: When the sell, onboard, and deliver workflow is spread across disconnected tools, important customer context and sentiment often get lost at every handoff. A unified GTM platform keeps the full deal, onboarding, and delivery context in one place, enabling Customer Success teams to clearly see customer confidence levels, spot early gaps, and address potential churn risks well before they impact renewals.
See how it works. Book a Projetly demo to see how teams prevent churn in real customer scenarios.
Early Warning Signs: Tracking Customer Churn Before It Happens
During onboarding, this customer never raised a red flag. Responsive, engaged, said all the right things.
But their language subtly shifted, and we missed the signals that later contributed to voluntary churn.
Timeline | Customer Language | What It Actually Means | Churn Risk |
|---|---|---|---|
Week 2 | "This should help streamline workflows" | Value is hypothetical, not proven | Monitor |
Week 6 | "Still figuring out how this fits" | Struggling to embed strategically | Caution |
Week 12 | "We'll revisit once things settle" | Mentally deprioritizing | High Risk |
Nothing alarming. Nothing escalated. But also nothing confident.
This language pattern is also known as customer disengagement, and it's one of the most reliable ways to predict customer churn.
Calculate Churn Risk by Tracking Language Patterns
Stop asking: "Did we complete the onboarding checklist?"
Start asking: "Could this champion defend our product to their CFO six months from now?"
The Confidence Score Framework:
Risk Level | Score Range | Typical Customer Language |
|---|---|---|
Low Risk | 8–10 | “This is not how we…” / “We’ve built this into…” |
Medium Risk | 4–7 | “This should…” / “We’re hoping…” / “Eventually…” |
High Risk | 0–3 | “For now…” / “Still figuring out…” / “We’ll revisit…” |
This churn analysis framework helps you calculate customer churn probability weeks before traditional metrics show problems.
Using Projetly: AI-powered insights flag language patterns across every customer interaction, emails, meetings, and task comments. Surface confidence drift before your next QBR with automated customer churn analysis.
Why Executive Disengagement Creates High Churn Rates
The pattern: Executive sponsor shows up to the kickoff, then vanishes.
Day-to-day users adopt tactically (solving immediate pain) but not strategically (betting their team's future on it).
When executives disengage after kickoff, your renewal depends on individual contributors who don't control the budget or strategic direction. This organizational disconnect drives voluntary churn in enterprise SaaS businesses and explains why the customer churn rate is high in many B2B companies.
How to Lower Churn Reduction Through Executive Engagement
30-60-90 Executive Engagement Checklist:
Day 30:
Schedule "value reconfirmation" call with executive sponsor
Ask explicitly: "What does success look like 12 months from now?"
Document answer in customer record (not just internal notes)
If misaligned with Sales promises → address immediately
Day 60:
Send executive-facing impact report (outcomes, not features)
Invite sponsor to strategic check-in (not product training)
Share wins that make them look good internally
Day 90:
Validate dependency: "What would break if we disappeared?"
Identify expansion opportunities
Schedule quarterly strategic reviews
Whether a customer stays or leaves often depends on executive-level conviction, not just end-user satisfaction. Track your churn rate against executive engagement to reveal patterns that help you predict customer churn.
Using Projetly: The Digital Sales Room that closes the deal becomes the onboarding workspace, allowing executives to see continuity, not handoffs. Strategic outcomes discussed during sales remain visible throughout the delivery process. This significantly improves overall customer experience and helps reduce churn and retain more customers.
The Sales Handoff Problem: Where Customer Attrition Really Begins
What the handoff looked like:
Thorough sales notes
Documented solution scope
Customer Expectations labelled "aligned"
What actually happened:
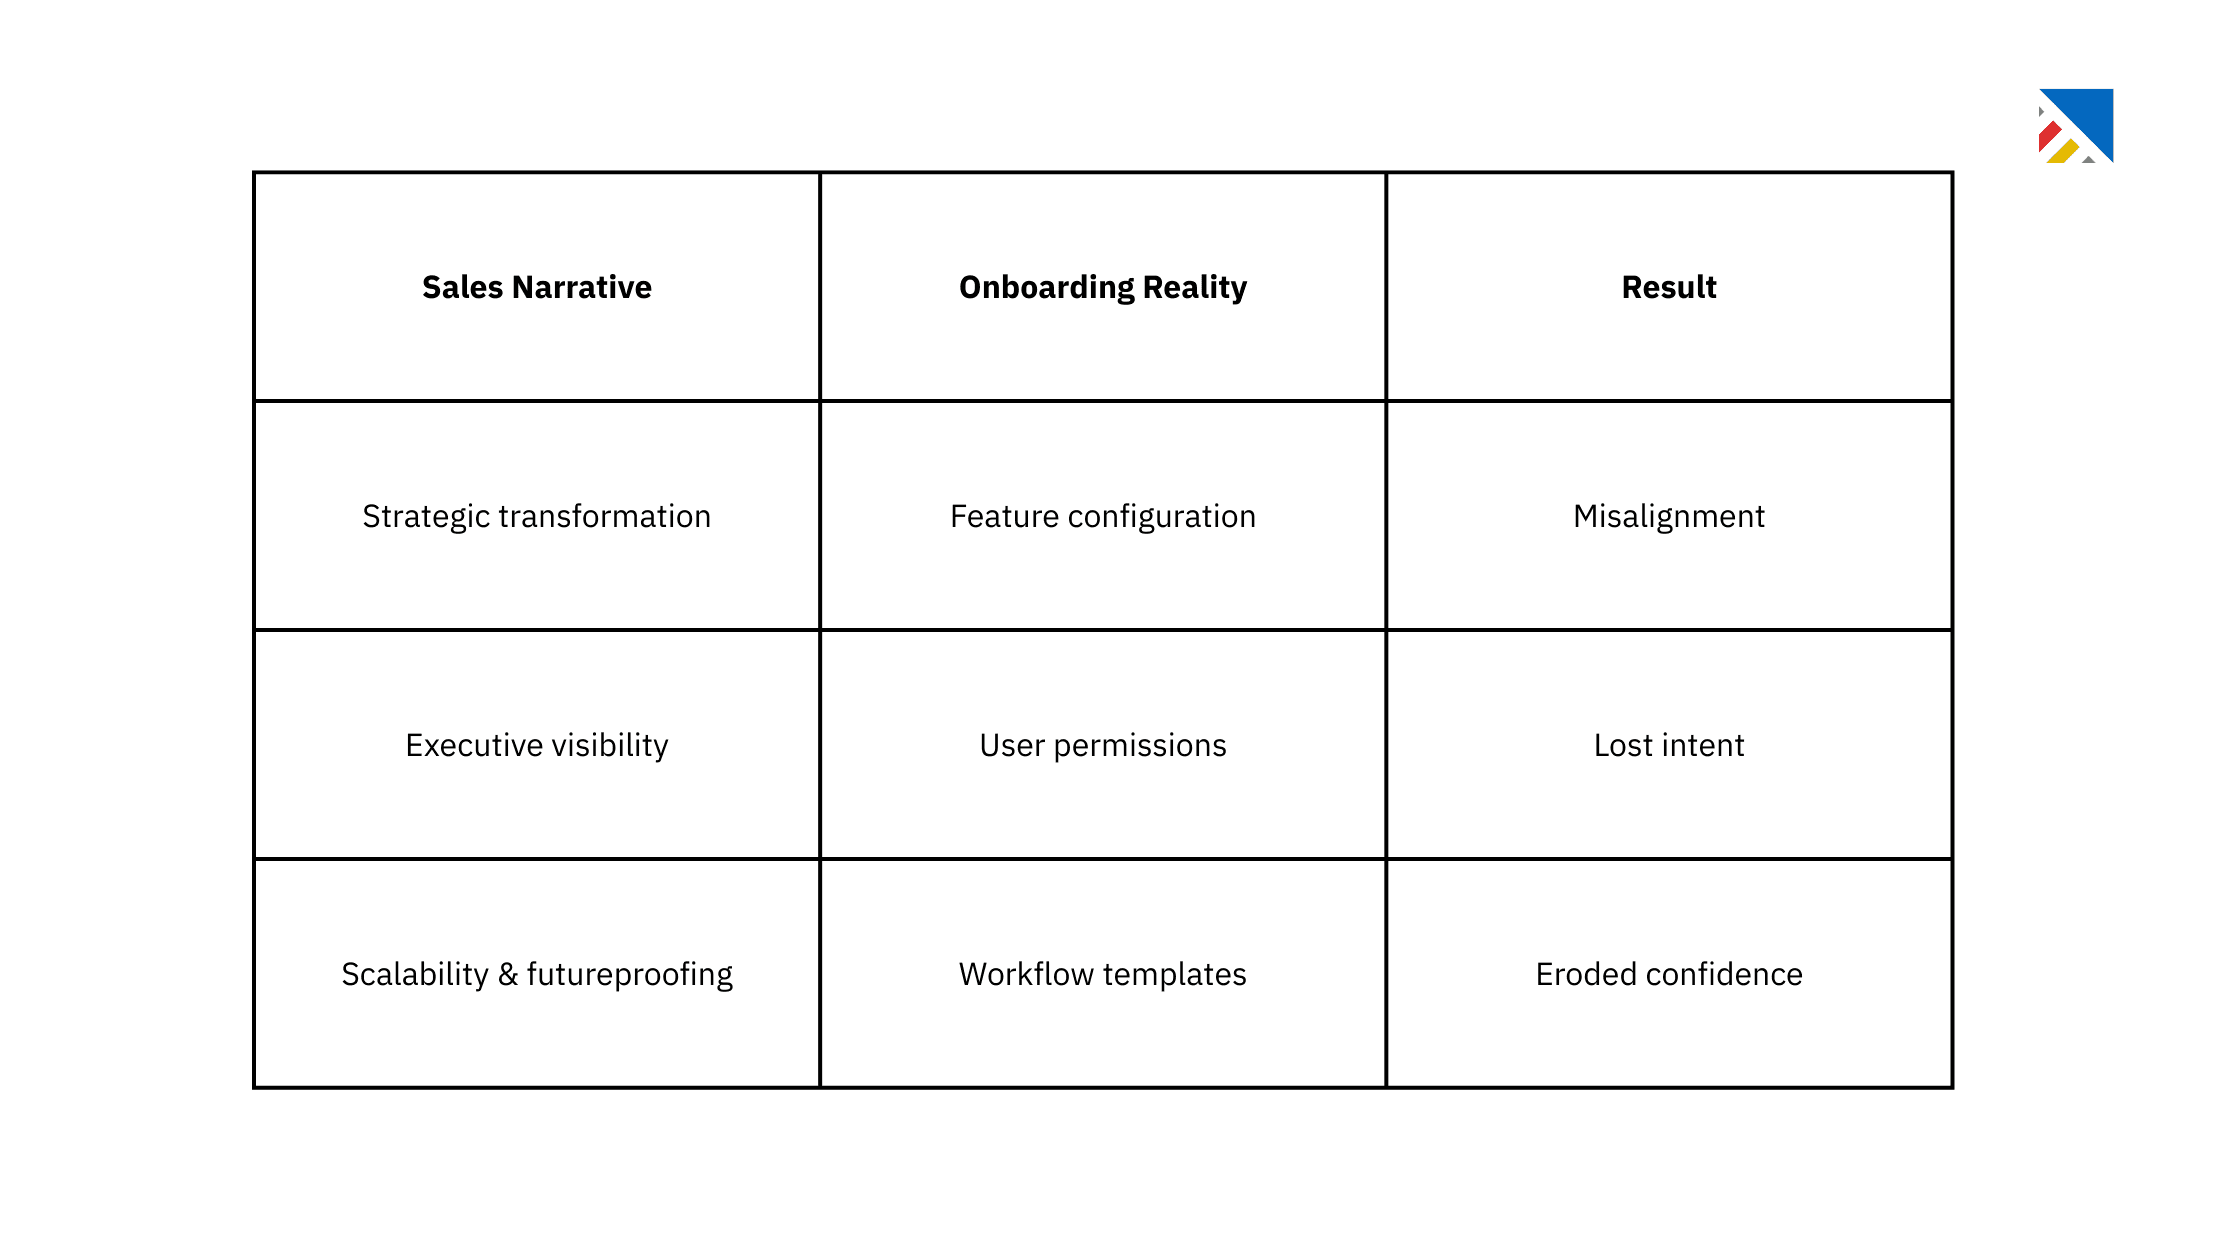
No one explicitly said: "Here's what we are NOT solving."
In enterprise environments, silence becomes an assumption, a pattern that leads to high churn rates across the existing customer base. Lost intent is a primary contributor to customer churn in B2B SaaS.
Reduce Customer Churn by Fixing the Handoff
The "Intent Bridge" Protocol:
Before First Onboarding Call:
Review sales narrative with AE, not just notes, but emotional pitch
Identify the "hero transformation" the customer bought into
Map onboarding milestones back to transformation (not just technical go-live)
During Onboarding Kickoff:
Restate the strategic vision from sales explicitly
Ask: "Is this still the outcome you're driving toward?"
If shifted, re-scope success metrics before implementation begins
Document what you're NOT solving
This is how you lower your churn rate at the source, preventing misalignment before it compounds.
Using Projetly: Sales context doesn't disappear when deals close. The Digital Sales Room transitions into the B2B onboarding project workspace. Proposals, commitments, and strategic discussions from sales remain accessible to delivery teams, ensuring intent doesn't get lost in translation.
Calculate Churn Rate Impact: The "Indifference Zone" (Months 3-6)
By month three, this account looked like:
Usage stabilized (but didn't expand)
No additional teams onboarded
No executive check-ins requested
No internal champions are emerging
From CS perspective: Not failing, just flat.
From the customer perspective: Helpful, but not essential.
This is the kill zone for enterprise SaaS, where your average churn rate quietly increases customer churn without triggering alarms.
Not frustration. Not dissatisfaction. Just indifference.
Indifference doesn't trigger alerts. It triggers quiet replacement conversations.
Industry Benchmarks: Know Your Churn Rate
Example: A churn rate of 3% monthly compounds to 31% annual attrition, devastating for growth.
Types of Churn You Need to Track and Reduce
Understanding the types of churn helps address root causes:
1. Voluntary Churn (60-80% of total)
Customers consciously decide to leave
Causes: lack of value, better alternatives, poor experience
Most are preventable with early intervention
2. Involuntary Churn (20-40% of total)
Payment failures, expired cards, and technical issues
Not intentional cancellation
Preventable with better billing processes
3. Revenue Churn
Monetary value lost from downgrades and cancellations
Revenue churn rates can be negative (expansion > losses)
The holy grail: negative revenue churn
Calculate your customer churn rate for each category to know your churn rate and prioritize retention efforts.
Churn Model for Months 3-6: Reduce Churn and Retain Customers
Month 3: Value Validation
Conduct mid-cycle review
Ask: "If this disappeared tomorrow, what would break?"
Vague answer = risk of churn (even if usage looks fine)
Calculate churn risk more accurately than health scores
Month 4: Champion Development
Identify users who gain the most from advocacy
Equip with business case templates (not product decks)
Track customer feedback from champions to predict customer churn
Month 5: Executive Re-engagement
Share outcomes, not activity metrics
Ask: "What would make this 10x more valuable?"
Build customer loyalty at the executive level
Using Projetly: Post-onboarding project templates include expansion milestones, turning passive account management into active value realization. Task reminders, automated follow-ups, and sentiment tracking ensure nothing falls through the cracks.
This systematic approach to customer success significantly improves customer retention rates, helping you reduce churn and retain more revenue.
How to Calculate Customer Churn: Metrics That Actually Matter
Standard health metrics said this account was fine:
Usage above minimum thresholds
No open support issues
Quarterly check-ins completed
Renewal flagged as "likely to churn"
But none answered the only question that matters:
"If this product disappeared tomorrow, what would happen to the customer?"
Answer: Not much.
Existing customers don't churn because they're angry. They churn because they can walk away without consequence, the essence of voluntary churn.
Calculate Churn Rate: The Formulas You Need
Monthly Churn Rate:
Annual Churn Rate:
Example: 5% monthly churn = 46% annual churn (far worse than it appears)
Revenue Churn:
Negative churn rate (expansion exceeds losses) = gold standard
Calculate churn rate by dividing lost customers by the total number of customers, but segment by churn type to prioritize solutions.
Related Blog: Customer Journey: Sales to Success Handoff Pain Points
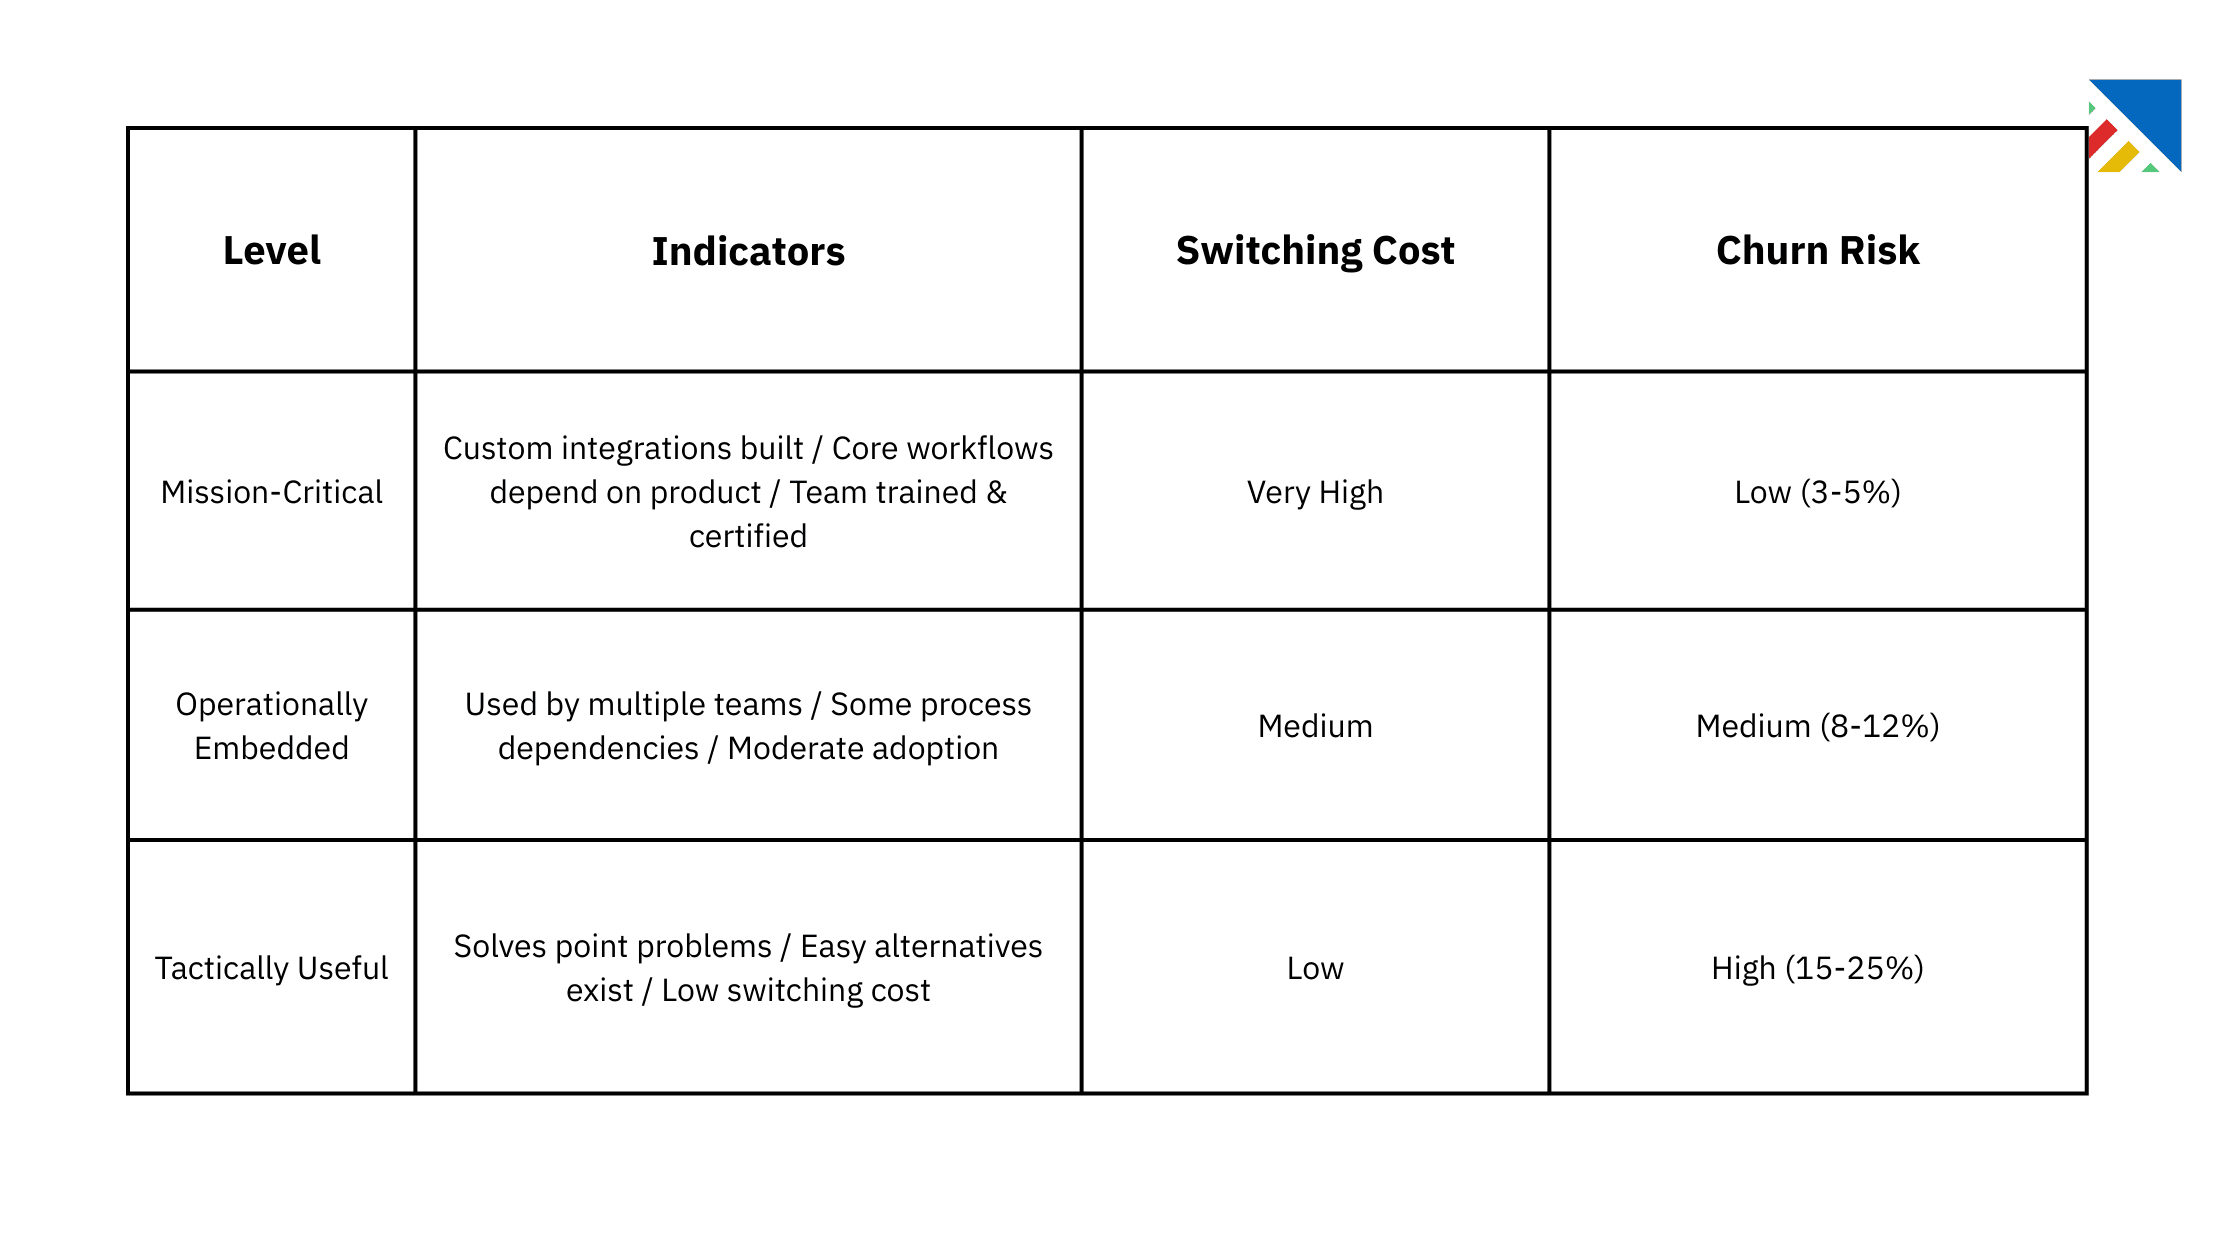
Build a Dependency Score to Predict Customer Churn
The Dependency Framework:
Level | Indicators | Switching Cost | Churn Risk |
|---|---|---|---|
Mission-Critical | Custom integrations built / Core workflows depend on product / Team trained & certified | Very High | Low (3-5%) |
Operationally Embedded | Used by multiple teams / Some process dependencies / Moderate adoption | Medium | Medium (8-12%) |
Tactically Useful | Solves point problems / Easy alternatives exist / Low switching cost | Low | High (15-25%) |
Assessment Questions:
What processes depend on this product?
How deep is the integration? (API usage, data syncs, automation)
Are customers investing in customization/training?
How many teams use advanced features?
The stronger your customer base in terms of dependency, the better your customer retention and the lower your customer churn rate over time.
Using Projetly: Full visibility into what was supposed to become mission-critical, and whether it actually did. This transparency is essential to reducing customer churn and improving customer lifetime value.
Customer Churn Prediction: The Renewal That Exposed Everything
Six months in, the renewal discussion surfaced what onboarding never resolved:
"We're not sure this became as strategic as we hoped."
"It didn't embed as deeply as we expected."
"We're consolidating vendors."
None of this was new information. It was simply no longer being softened.
By the time churn risk became visible, the work required wasn't onboarding; it was repositioning under pressure.
Repositioning at renewal is 10x more expensive than alignment during onboarding. Plus, you've likely lost customer confidence, the foundation of customer retention.
What Happened (Too Late to Prevent Customer Churn)
The scramble:
Re-scoping success outcomes mid-contract
Re-engaging executives who mentally moved on
Reframing value while trust eroded
Attempting to improve customer satisfaction when the relationship is damaged
The cost:
Escalations, discounts, political capital
Not just revenue credibility with your customer base
Reality check: Saving a churning customer at renewal requires 5-10x the resources vs. proactive retention during onboarding. Yet the success rate is significantly lower.
Retaining an existing customer is always cheaper than acquiring a new one, but only if you intervene early. The time to reduce customer churn is months 1-6, not month 12.
By the time the customer churn rate is high enough to trigger alerts, you've already lost most accounts.
Customer Churn Analysis: What Went Unspoken
This wasn't a product failure. It wasn't a delivery failure.
It was an alignment gap that never closed.
Existing customers never fully articulated their doubts
The team never fully validated confidence
Everyone assumed silence meant stability
In enterprise SaaS, silence often means risk avoidance, not customer satisfaction.
Companies with poor post-onboarding validation see customer churn rates 2-3x higher than those who actively measure and address confidence gaps.
Understanding customer churn issues requires looking beyond traditional metrics to emotional and political dynamics along the customer journey.
These customer churn issues are the drivers of churn that never appear in dashboards until it's too late.
Ways to Reduce Customer Churn: The CS Leader's Action Plan
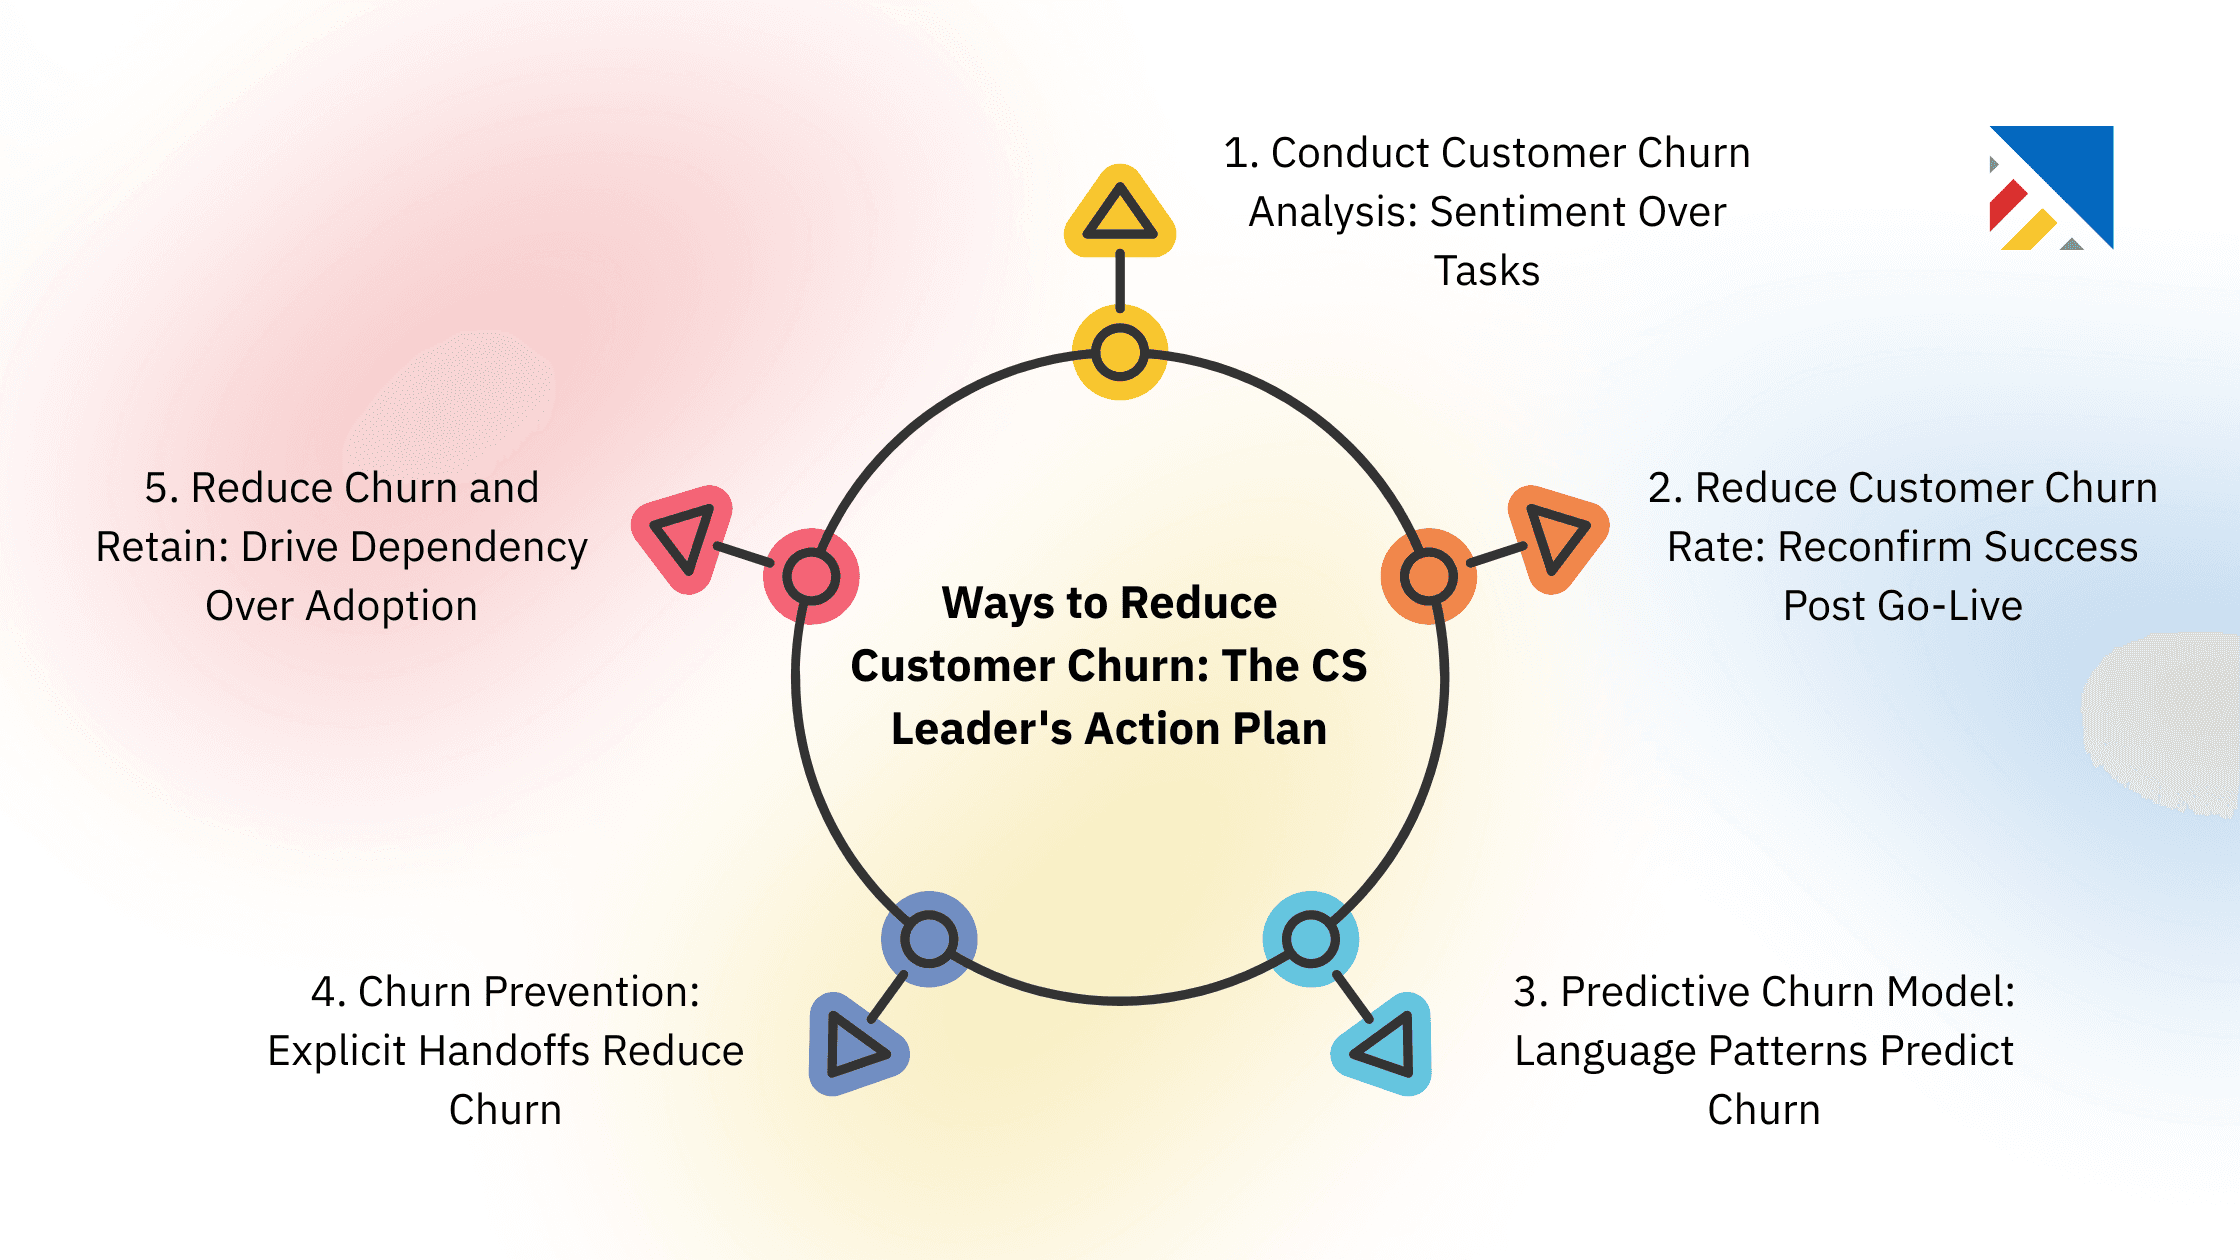
1. Conduct Customer Churn Analysis: Sentiment Over Tasks
Stop asking: "Are we alive?"
Start asking: "Could you defend this product internally in 6 months?"
Implementation Checklist:
Weekly sentiment check-ins during onboarding
Language pattern tracking to detect early churn signals
Champion confidence scoring to predict customer churn
Customer engagement metrics beyond logins
Systematic customer feedback tracking
This churn analysis helps you understand what customer churn looks like in its earliest stages.
Projetly: AI-powered meeting insights and email analysis automatically flag sentiment shifts. This predictive churn model helps you intervene before customers leave.
2. Reduce Customer Churn Rate: Reconfirm Success Post Go-Live
Enterprise success criteria evolve once reality sets in. Customer needs shift with hands-on experience. This is a critical moment where churn happens if expectations aren't realigned.
30-Day Post Go-Live Protocol:
Schedule a success reconfirmation call
Ask: "Now that you've used this for a month, what does success look like?"
Update success metrics based on their answer
Address misalignment before month 2
Measure customer satisfaction with updated criteria
One of the most effective ways you can reduce customer churn is early. The churn rate can help you benchmark whether your post-go-live process is working.
Projetly: Success criteria documented during sales remain visible in the B2B onboarding workspace easy to validate whether reality matches expectations.
3. Predictive Churn Model: Language Patterns Predict Churn
Words like "for now," "eventually," and "still figuring out" are leading indicators of customer churn.
These linguistic patterns appear weeks before traditional health scores indicate risk, making them powerful tools for customer churn prediction.
Warning Phrase Library:
Phrase | Risk Level | What To Do |
|---|---|---|
"For now..." | High | Immediate intervention call |
"Eventually..." | Medium | Schedule value review |
"Still figuring out..." | Medium | Offer additional training |
"We'll revisit..." | High | Executive escalation |
"It's fine..." | Low-Medium | Monitor closely |
Implementation:
Train the CS team on confidence vs. conditional language
Create a shared glossary of warning phrases
Flag accounts when language patterns shift
Calculate churn risk more accurately than usage metrics
This helps identify a high-risk customer who's about to have a bad customer experience before damage is done.
Projetly: AI email and meeting analysis detects language pattern shifts automatically. Prevents customer churn by intervening at the first signs of doubt.
4. Churn Prevention: Explicit Handoffs Reduce Churn
What Sales promised must be operationalized or consciously re-scoped.
Misalignment at handoff is a top contributor to high churn in enterprise SaaS. When customer relationships transition poorly between teams, customer churn accelerates.
The "Intent Bridge" Framework:
Pre-Onboarding:
Formal session: Sales + Onboarding + CS
Document strategic outcomes (not just technical requirements)
Explicit gap identification: "Here's what we're NOT solving"
A customer relationship management system maintains context
During Transition:
Transparent communication that builds customer satisfaction
Validate understanding with the customer directly
Confirm executive sponsor engagement commitment
Projetly: Digital Sales Room becomes an onboarding workspace, sales context, proposals, and strategic commitments flow directly into delivery. No re-interpretation. No lost intent.
This continuity is essential to reduce customer churn and strengthen customer relationships throughout the customer journey.
5. Reduce Churn and Retain: Drive Dependency Over Adoption
Usage metrics are lagging indicators. Dependency is a leading indicator.
The number of customers logging in daily doesn't matter if they could easily switch tomorrow. To keep an existing customer, you need them to be dependent on your product for critical workflows.
Dependency Building Milestones:
Month 1-2: Foundation
Basic integration with existing tools
Team training on core workflows
Initial process documentation
Month 3-4: Expansion
Additional team onboarding
Advanced feature adoption
Custom configuration begins
Month 5-6: Embeddedness
Critical business processes depend on the product
Custom integrations deployed
Executive visibility and reporting established
Assessment Questions:
"What would break if we disappeared?"
Track process integration depth
Measure customer investment (time, customization, training)
Calculate churn risk based on dependency, not usage
Focus on improving customer lifetime value through strategic embeddedness
This creates an increase in customer retention that compounds over time.
Projetly: Project templates include "dependency milestones"—ensuring onboarding doesn't end at go-live, but at strategic embeddedness. Transforms new customers into deeply integrated partners.
Projetly: Making Customer Churn Visible Before It Happens
By unifying Sell, Onboard, and Deliver in one GTM workflow:
Sales context survives post-close: Digital Sales Room transitions seamlessly into onboarding proposals, commitments, and buyer intent, which stay visible. Prevents misalignment that drives customer churn.
Onboarding decisions stay accessible downstream: What was promised, scoped, and excluded is documented for CS teams, eliminating context loss that leads to customer attrition.
Customer sentiment tracked across teams: AI-powered insights monitor language patterns, engagement signals, and confidence trends across emails, meetings, and tasks. Customer churn prediction spots risk before customers leave.
Onboarding becomes continuous churn prevention: Post-onboarding expansion, value realization, and dependency milestones are built into the delivery workflow, driving customer retention beyond initial implementation.
CS teams reduce customer churn proactively: See customer churn forming early enough to intervene with retention strategies to reduce churn.
Related Blog: Customer Onboarding Scorecard: Client Onboarding Metrics
Your Next Steps: Stop Churn Before It Starts
If your B2B onboarding looks healthy but renewals feel unpredictable, the issue isn't delivery, it's what went unspoken early.
Customer churn doesn't start with a cancellation email. Customer churn happens gradually through quiet misalignment during onboarding.
The seeds of customer churn are planted during onboarding, but they don't have to grow.
With the right visibility, questions, and workflow, CS leaders catch confidence gaps before they become churn statistics. Improve customer experience, strengthen customer relationships, and reduce customer churn rate while scaling your customer base.
Understanding your churn rate might be uncomfortable, but it's essential. The churn rate can help you identify problems early.
The Choice is Yours
Continue losing 7-10% of your existing customer base annually to preventable churn
Or implement a system that makes customer churn visible and preventable
You may also like

A Guide to Project Management Professional Certification

Laugh Your Way to Productivity: 50 Workplace Quotes

50 Funny Workplace Memes That’ll Brighten Your Workday.

What Does a Customer-First Mindset Mean? Explained in 2025

What It Takes to be a Great Customer Success Manager in 2025

