Digital Sales Room

By
Anuj

What Are the 9 DSR Metrics Every B2B Sales Manager Should Track in 2026?
The 9 DSR metrics that matter are: active stakeholder engagement, time-to-action, content consumption and page time, document download rate, prospect-to-prospect sharing, video interaction rate, MAP completion rate, session duration per visit, and room-to-close conversion rate. Read in combination, not in isolation, these metrics separate deals with real momentum from deals that quietly stall.
Most DSR software reporting stays superficial, link opens, last-activity timestamps, and document view counts. That's not pipeline intelligence. These 9 DSR metrics are the ones that actually predict deal outcomes.
Why do most DSR metrics programs fail to change rep behavior?
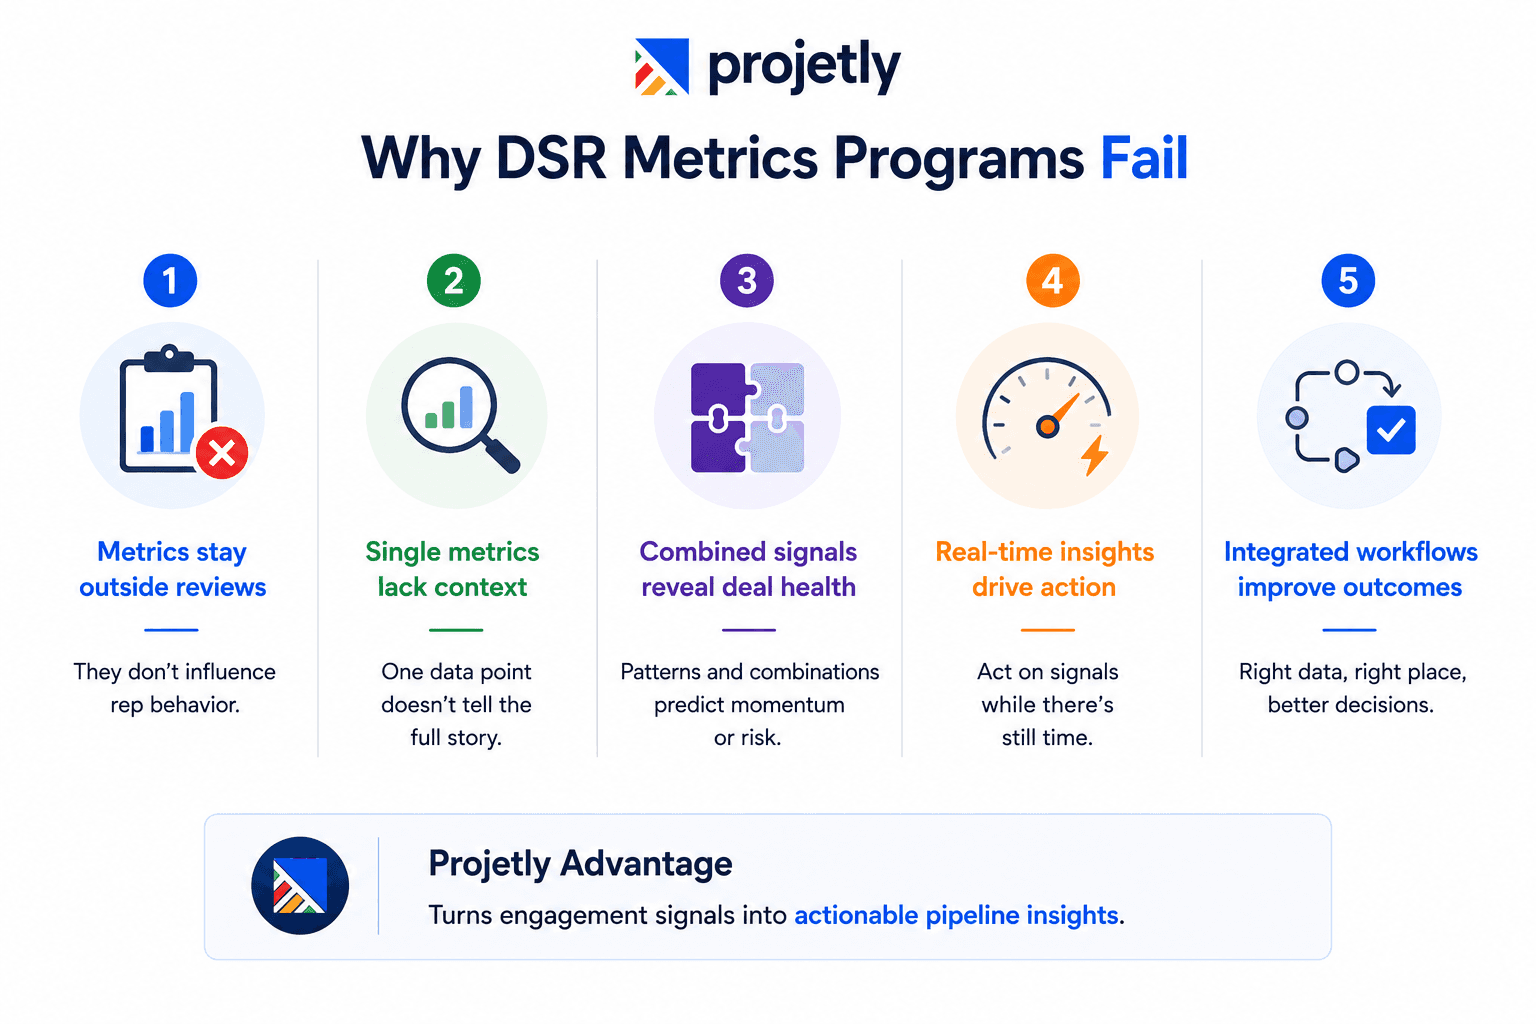
Most DSR metrics programs fail not because the data isn't available, but because the metrics never surface in pipeline reviews.
Metrics that live inside the DSR platform but never reach a pipeline conversation don't change rep behavior. They give managers something to look at after a deal has already died.
The second failure is reading metrics in isolation. High video engagement may look positive. A MAP stall may trigger panic. But neither tells the full story alone.
The real predictors of deal outcomes are metric combinations. Knowing which patterns signal momentum versus risk is what separates revenue managers from activity trackers.
Where Projetly fits: Projetly surfaces DSR engagement data, stakeholder activity, MAP progress, and content signals directly inside your pipeline workflow, so managers act on signals in real time, not after close dates slip.
A) Active Stakeholder Engagement
Active stakeholder engagement measures unique verified users interacting with the DSR and the frequency of their return visits over time.
Enterprise deals involve 6–10 stakeholders across procurement, IT, finance, and end-user teams. One person touching your DSR three weeks in isn't a deal; it's a champion with no internal authority.
Single-threaded deals fail disproportionately at final approval because the buying committee never formed.
What to do:
Flag any deal above your ACV threshold with fewer than 3 unique stakeholders at the proposal stage for manager review.
End every discovery call with: "Can I set up a space your CFO and IT lead can access directly?"
Dangerous combination to watch:
Signal | What it looks like | What it really means |
|---|---|---|
1 active stakeholder + strong MAP completion | Healthy on the surface | Champion is sandbagging a consensus problem or hasn't involved the real decision-maker |
3+ stakeholders + zero MAP progress | Broad interest | No internal owner is driving the deal forward |
B) Deal Room Time-to-Action
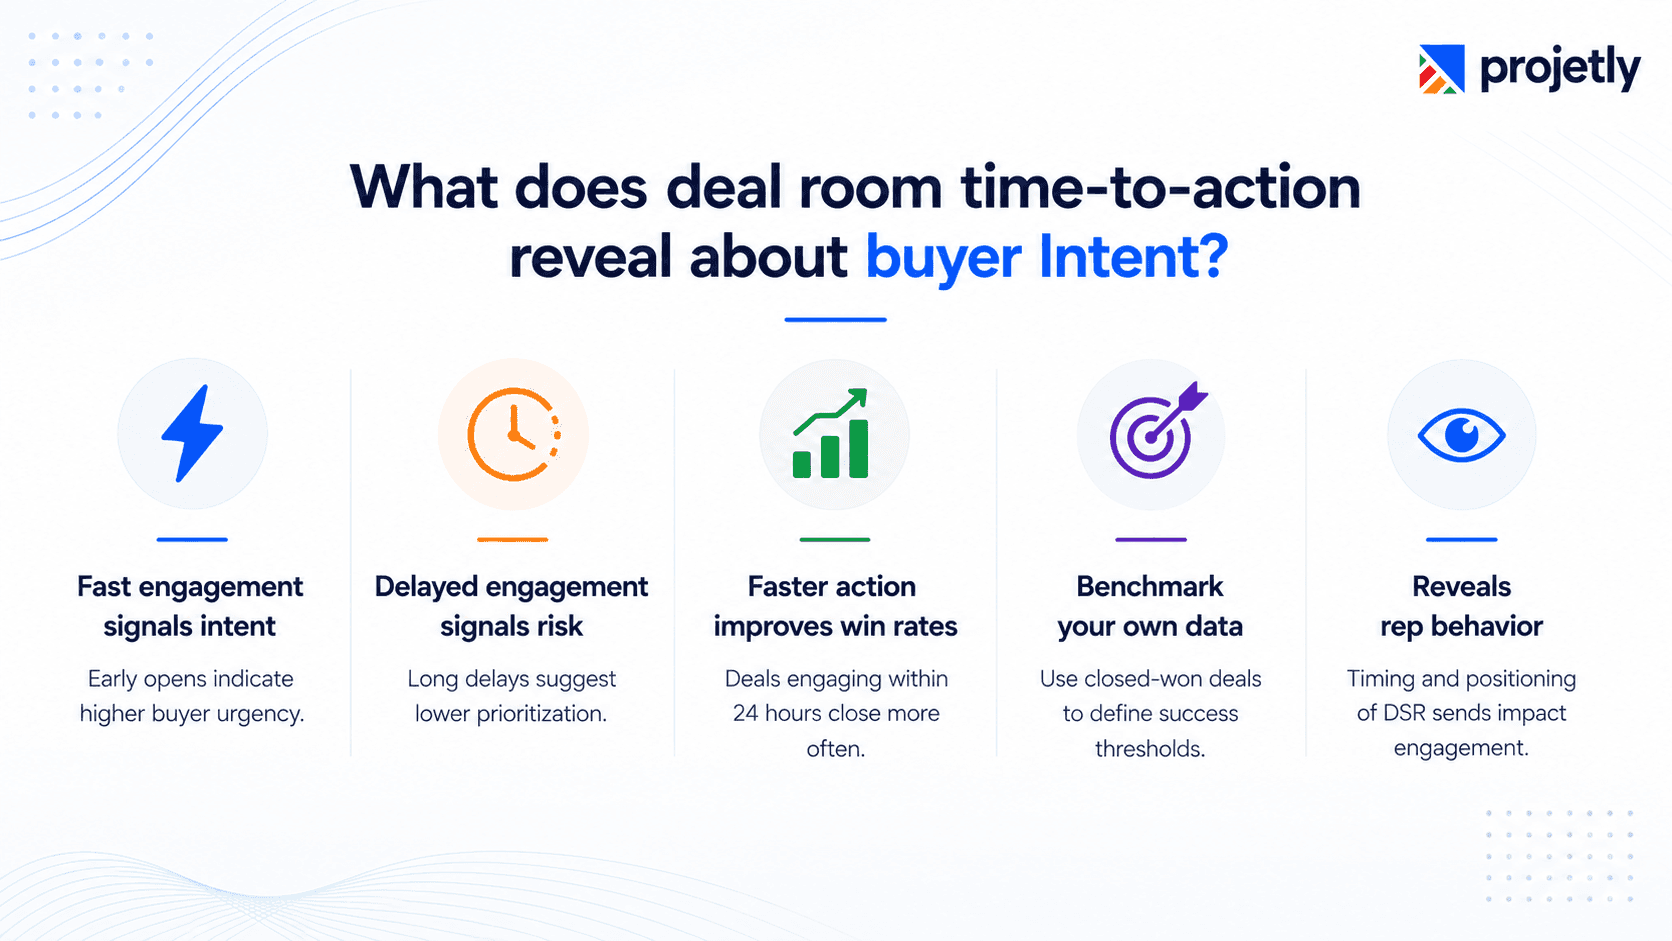
Time-to-action measures the elapsed time between when a rep sends the DSR link and when the prospect first opens it.
Speed of first engagement is one of the clearest proxies for buyer intent. Clicking within 15 minutes signals urgency. Waiting 4 days signals a prioritization problem your CRM won't surface.
Deals with first engagement within 24 hours close at significantly higher rates than those delayed beyond 72 hours.
What to do:
Pull your closed-won cohort and calculate your own time-to-action benchmark; use that, not industry averages.
If a rep's average consistently exceeds that benchmark, the issue is upstream: ICP fit, outreach quality, or how the DSR send is being positioned.
This metric also exposes rep behavior. A DSR sent Friday before a long weekend isn't a deal risk; it's a self-created one.
C) Average Content Consumption and Page Time
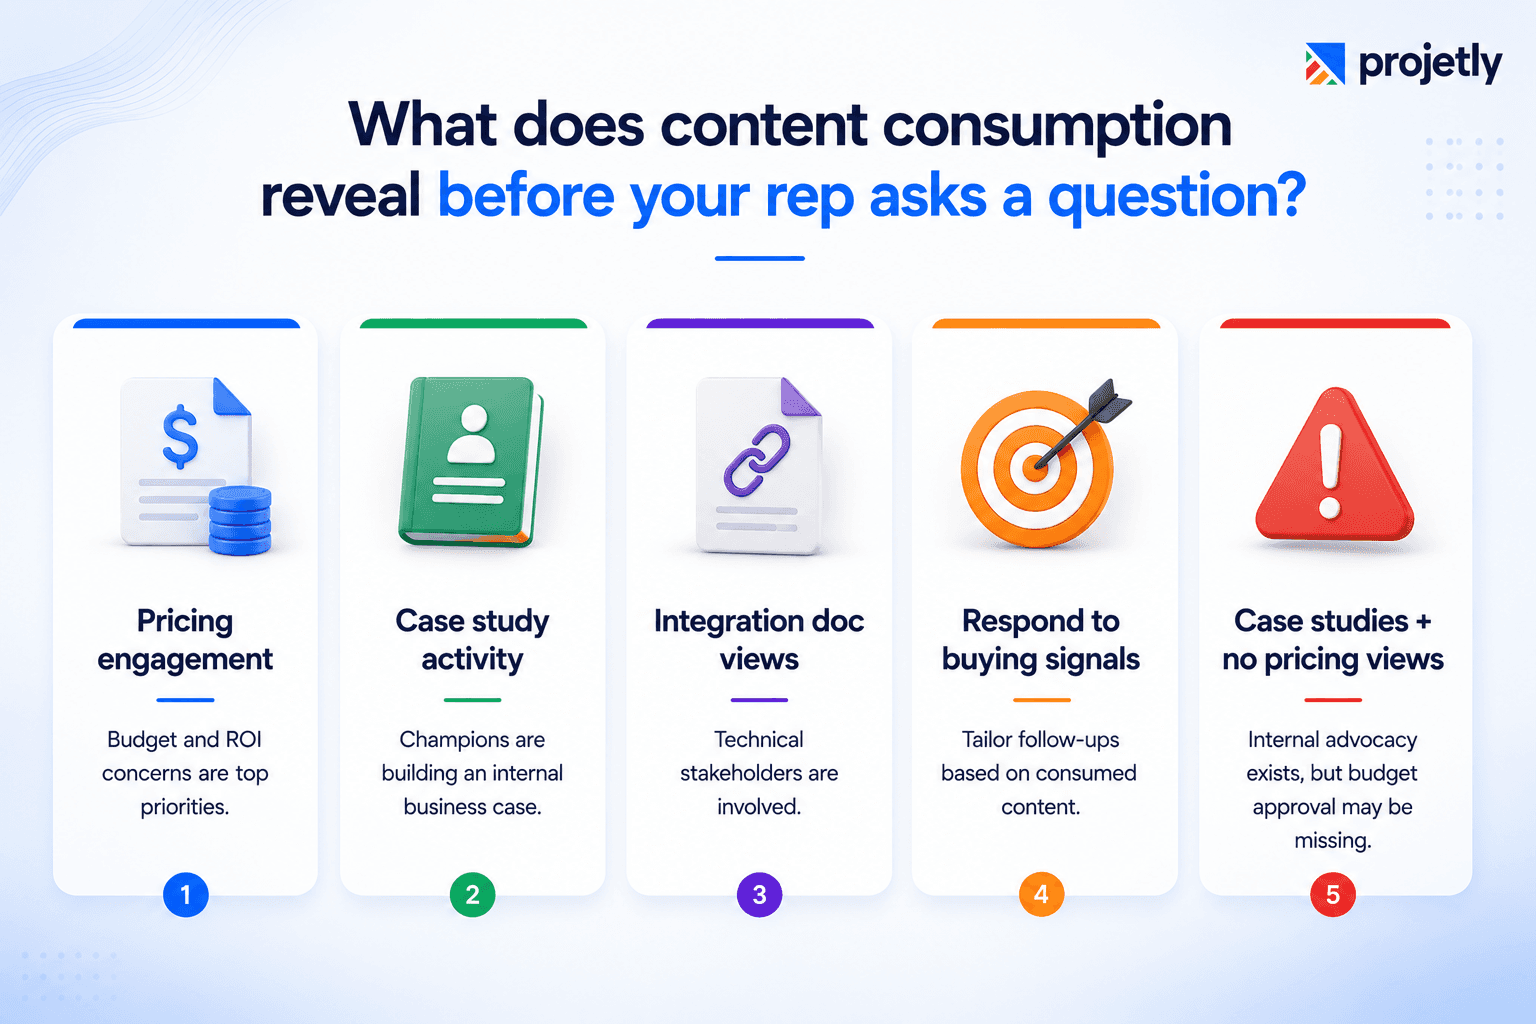
Content consumption measures time spent on individual assets, pricing sheets, ROI calculators, technical docs, case studies, and competitive comparison pages.
14 minutes on pricing + 40 seconds on implementation = cost justification is the real hurdle, not technical fit. Heavy case study consumption in the 72 hours before a committee meeting = a champion actively building an internal business case.
Heavy time on integration docs = IT has joined the evaluation, even if they haven't introduced themselves yet.
What to do:
Set content engagement thresholds by asset type and respond specifically.
Prospect spent significant time on pricing, but hasn't touched the ROI calculator?
Fill the gap directly: "Before Thursday, put your numbers into this model, we'll stress-test it live together."
Dangerous combination: High case study time + zero pricing engagement late in the cycle = your champion is still selling internally and budget approval hasn't started. Shift from selling to enabling with a financial narrative, not product content.
D) Document Completion & Download Rate
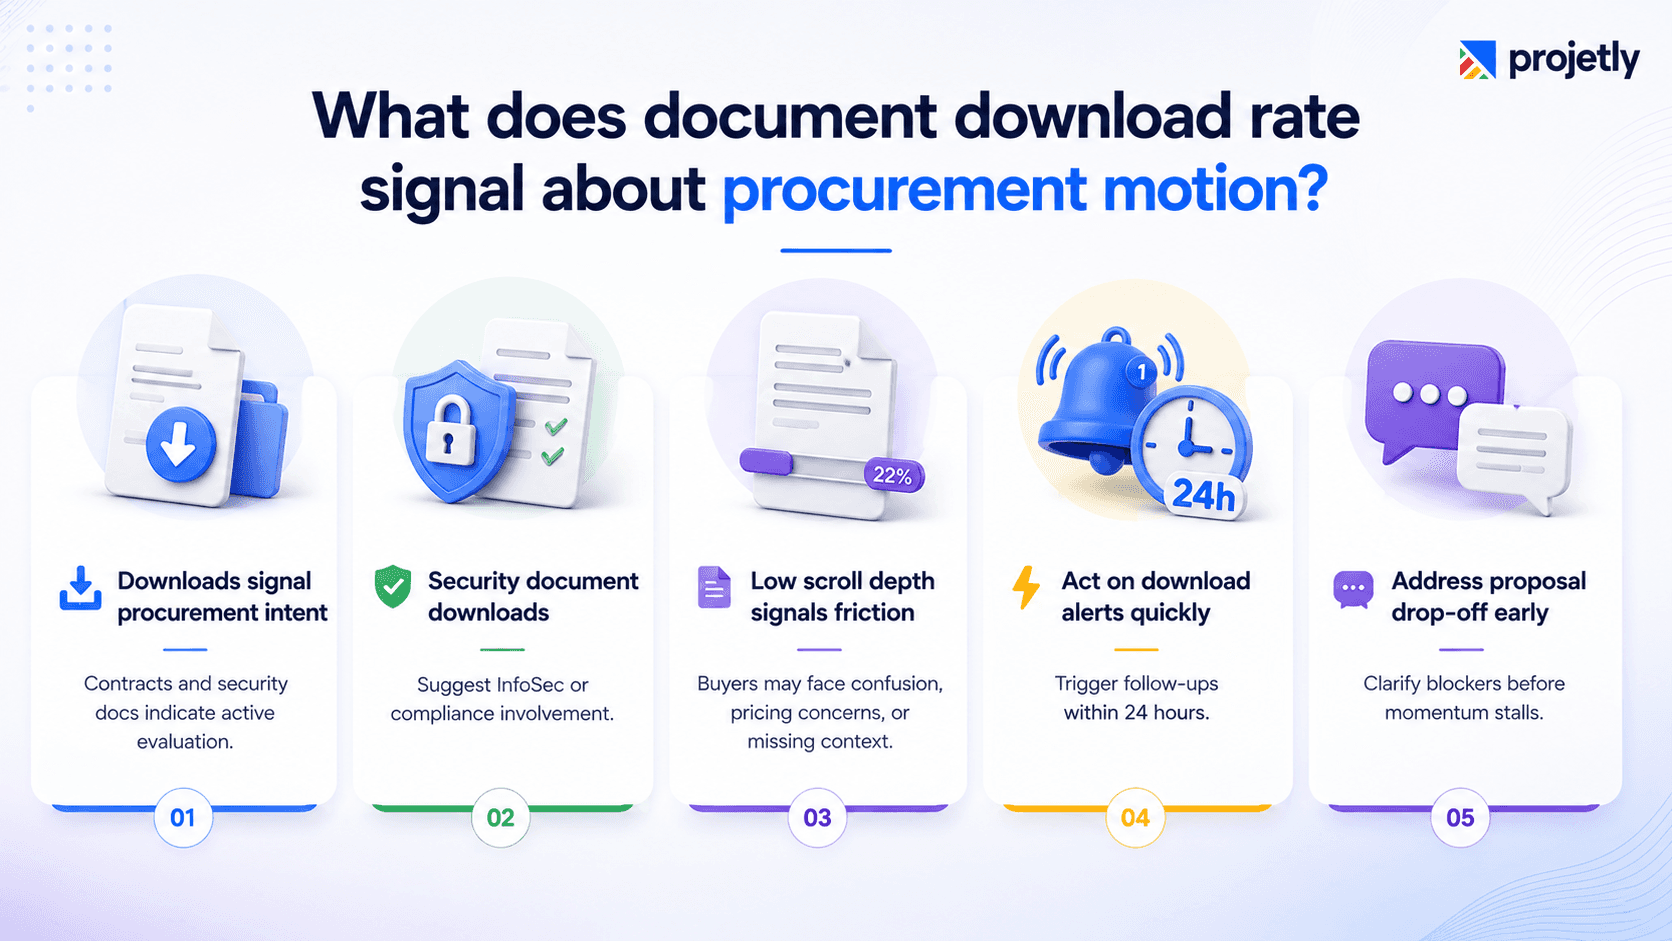
Document download rate measures scroll depth and downloads of specific files, contracts, security questionnaires, technical specs, and legal terms.
A download is a commitment signal, not a content engagement signal. Downloading your security architecture doc = preparing to hand it to InfoSec for vendor review. That's an active procurement motion, often the first concrete evidence a deal has crossed from "we're interested" to "we're evaluating."
Scroll depth tells a different story. A proposal opened, but only 22% viewed means the buyer hit a barrier early, confusion, sticker shock, missing context, and stopped.
What to do:
Configure download alerts as real-time CRM triggers.
Any download of a security questionnaire, contract, or technical spec should auto-create a rep follow-up task within 24 hours.
For low scroll-depth proposals, reach out directly: "Sometimes people hit a question on the first page that makes it hard to read past it. Anything I can clarify?"
E) Prospect-to-Prospect Sharing (Viral Coefficient)
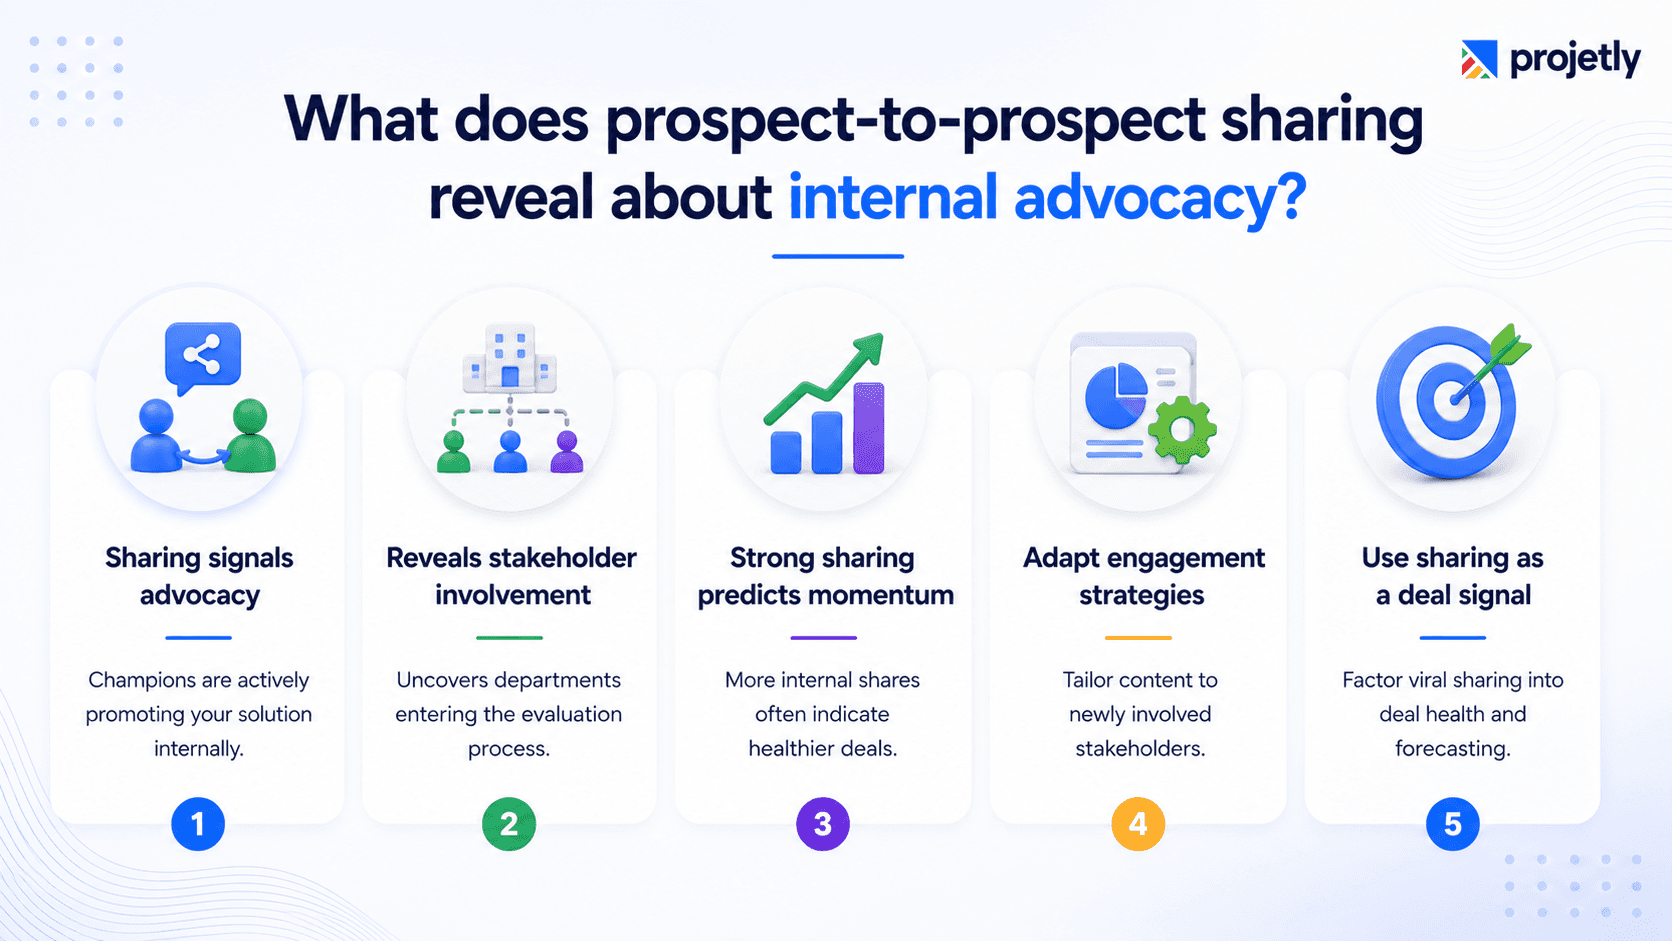
Prospect-to-prospect sharing (viral coefficient) measures secondary and tertiary stakeholders invited into the DSR by the prospect, not by your rep.
When a buyer shares your DSR unprompted, they are actively selling your solution internally. It means your champion has enough conviction to put their own credibility behind you.
It also gives you an unsolicited org chart; you can see exactly which departments are now in the room and where remaining friction is likely to sit.
What to do:
Track by deal stage and weight heavily in your deal health score.
A viral coefficient of 3+ should trigger a close probability increase in your CRM. Coach reps to acknowledge and accelerate this behavior: "I saw a few more colleagues join, I've added a section tailored to the finance team's typical questions."
Signal interpretation by a new joiner:
Legal joined → Prepare for contract redlines proactively
Finance joined with no prior pricing engagement → Send a CFO-specific one-pager before they build their own cost model from incomplete data
F) Video and Demo Interaction Rate

Video interaction rate measures the completion rate of embedded walkthroughs, async demo recordings, and interactive product tours within the DSR software.
Your reps can't be in every internal stakeholder meeting. Your DSR video is the only version of your pitch that reaches people who've never spoken to your team.
85% of a 12-minute walkthrough watched = that stakeholder has essentially attended a demo. 9% watched = a knowledge gap that will surface as an objection on a call your rep thought was about pricing.
What to do:
Segment completion rates by stakeholder role, don't just track aggregate numbers.
Procurement buyers routinely skip product demos entirely, creating a mismatch between what they think they're buying and what the end-user team is evaluating.
Use low video completion as a pre-call intervention: "I want to spend the first 10 minutes of our call going through the implementation walkthrough, so we're working from the same baseline."
G) Mutual Action Plan (MAP) Completion Rate
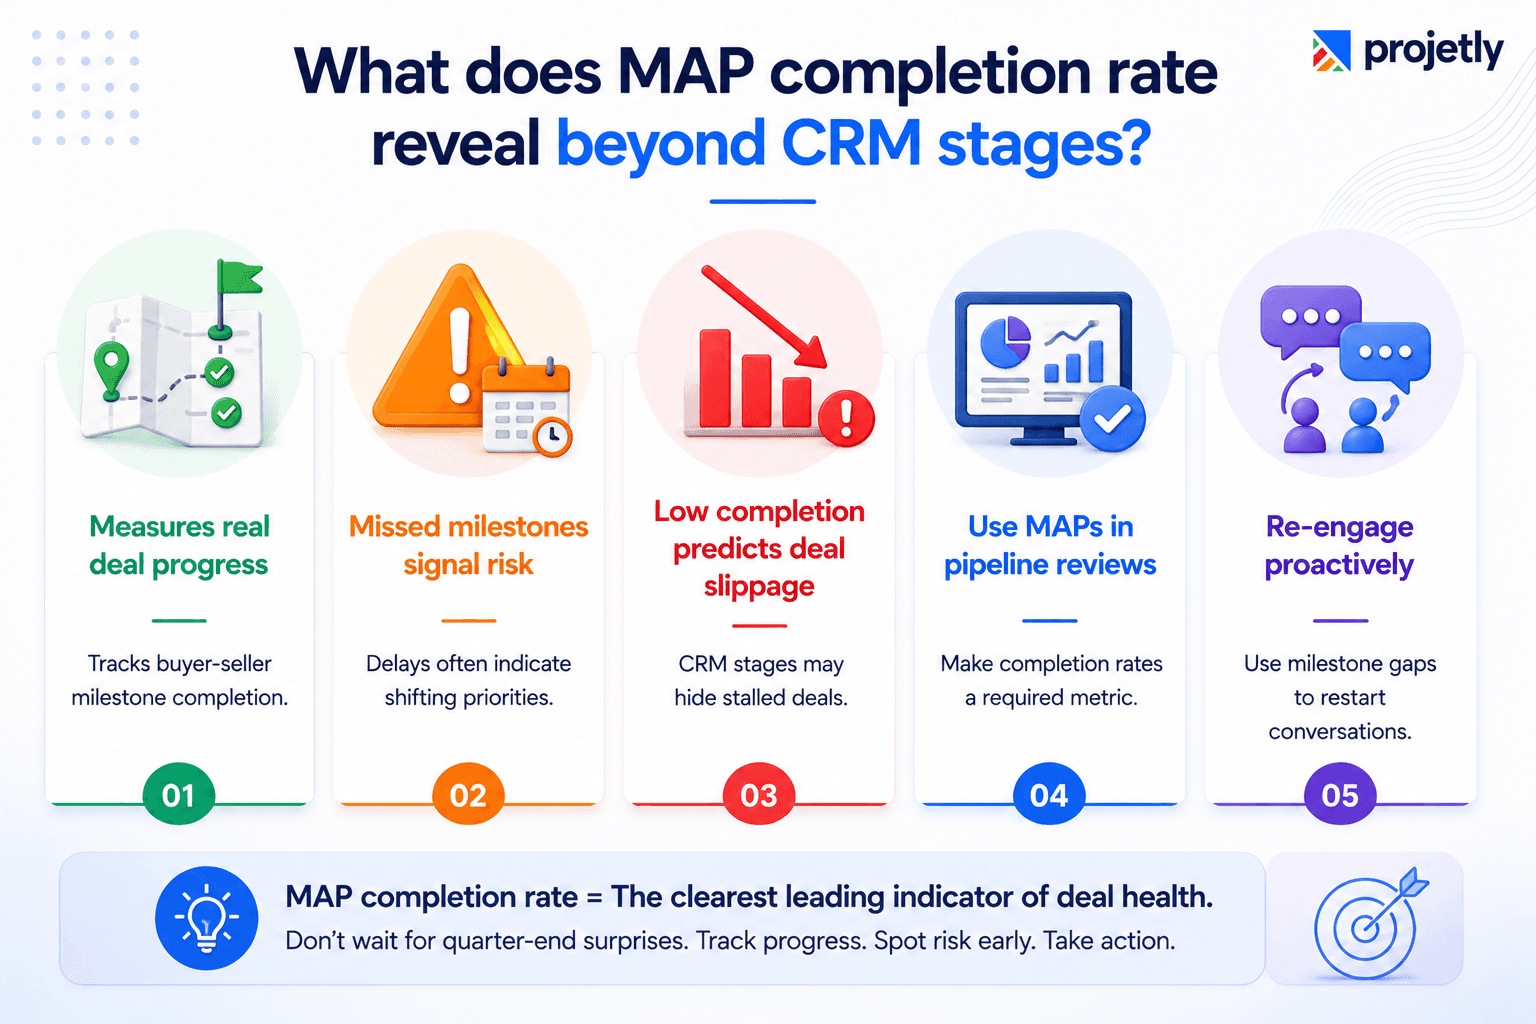
MAP completion rate measures progress against shared milestones, checklist completions, and next-step deliverables agreed upon by both buyer and seller inside the DSR.
A rep who builds a detailed MAP on day one and never references it again hasn't created deal infrastructure; they've created administrative theatre that the buyer quietly stops engaging with by week three.
Two missed milestones in a row = something shifted internally, budget freeze, competing priority, or a champion who's lost momentum, before it becomes a quarter-end surprise.
What to do:
MAP completion rate belongs in every pipeline review as a required field for deals closing within 60 days.
Any deal with completion under 50% and a close date within 45 days is at risk, regardless of CRM stage.
Use milestone gaps as a direct re-engagement opener: "I noticed we've got a few milestones we haven't progressed on. Is anything shifting on your end that's worth a quick conversation before we reset the timeline?"
H) DSR Session Duration Per Visit
Session duration measures the average time a buyer spends actively engaging with content during a single DSR session.
14 visits at 40 seconds each ≠ , high engagement. It's a buyer repeatedly checking in and not finding what they came for, a content relevance failure that looks like strong engagement in visit-count reporting.
3 visits at 20 minutes each, progressing from overview → ROI model → technical specs = a genuine evaluation sequence. Those two patterns require completely different responses.
What to do:
Build session duration benchmarks segmented by deal stage.
Mid-funnel deals averaging under 5 minutes per session have a content relevance problem; curate the room more tightly
Late-stage deals averaging over 18 minutes per session are in active evaluation mode; they need close-focused conversations, not another check-in discovery call
Pull closed-won session duration data by deal stage from your DSR platform. It's a 30-minute analysis that will change how you run pipeline reviews.
I) Deal Room Conversion Rate (Room-to-Close)
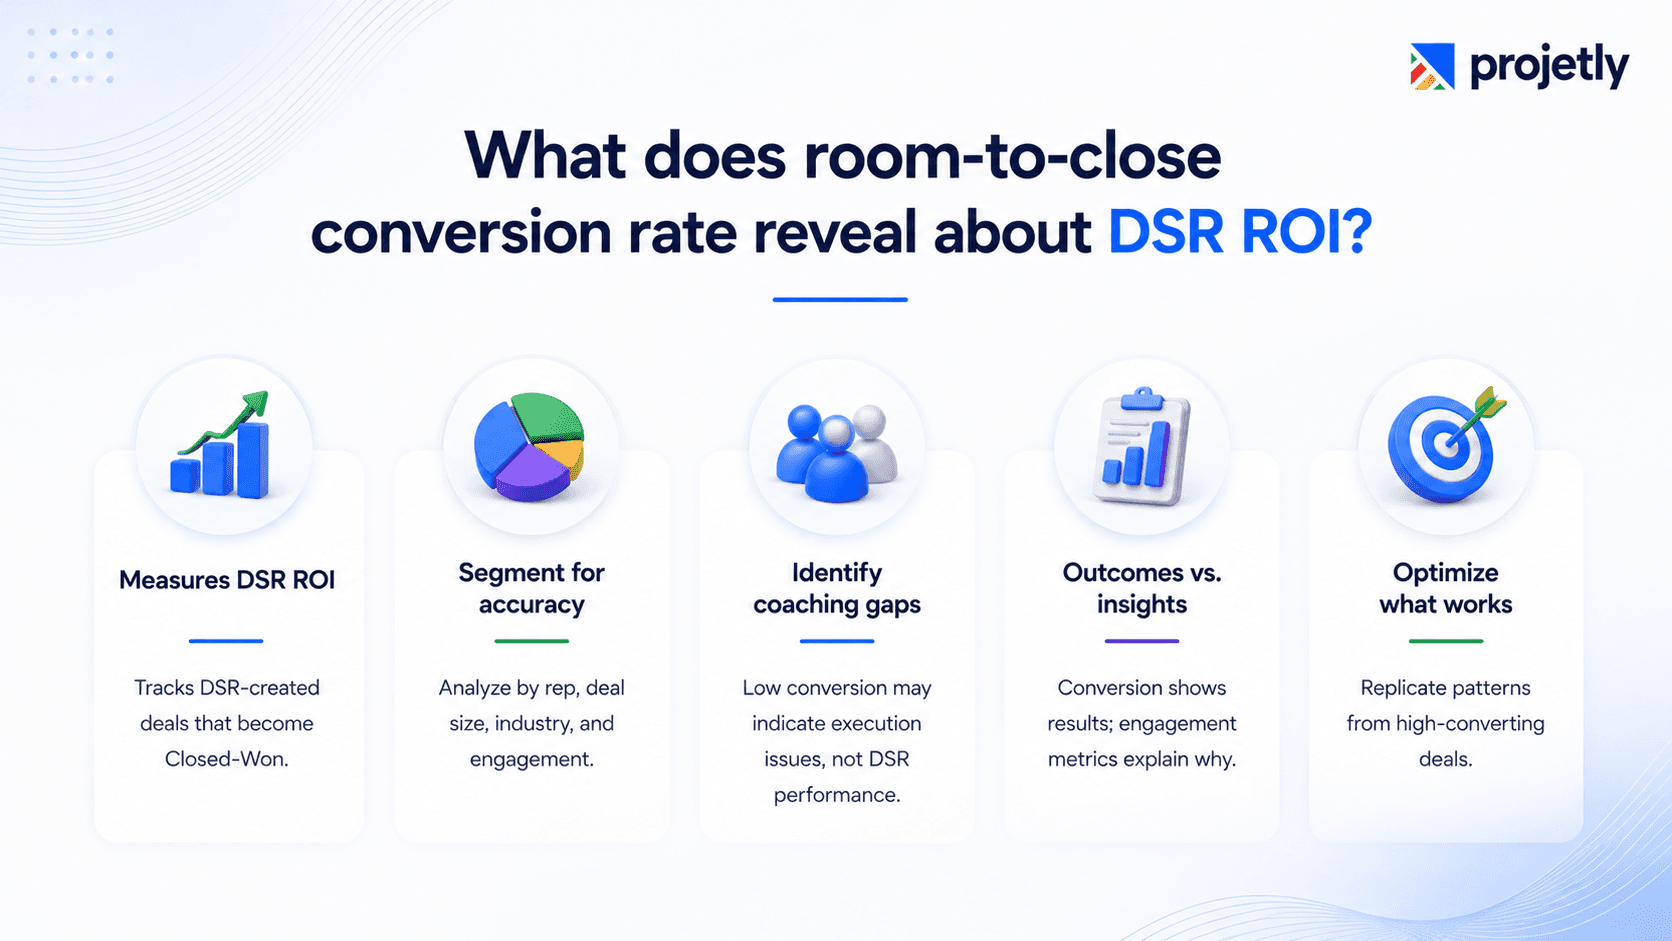
Room-to-close conversion rate measures the percentage of deals progressing from initial DSR creation to Closed-Won within a defined time window.
This is the ROI metric for your entire DSR investment, and the baseline against which every other metric should be evaluated. But aggregate conversion rate is also the metric most likely to mislead you without segmentation.
A 34% room-to-close rate sounds strong until you realize it's driven entirely by two top reps, while the bottom half closes at 12%. That's not a DSR performance problem; it's a coaching problem wearing a DSR performance mask.
What to do:
Segment conversion rate in four ways: by rep, deal size tier, industry vertical, and DSR engagement score.
The deals that convert at the highest rate are the ones where all eight engagement metrics were actively monitored and acted on.
Conversion rate tells you the outcome. The other eight metrics tell you why.
See how Projetly tracks all 9 DSR metrics in one pipeline view →
How do you turn these 9 DSR metrics into a deal health scorecard?
A deal health scorecard translates individual DSR signals into a single number you can use in a pipeline review, replacing rep sentiment and CRM stage optics with verified buyer behavior.
Score each active deal weekly. Any deal scoring below 55 points with a close date inside 45 days needs manager attention, not rep reassurance.
DSR Deal Health Scorecard
Metric | Max Points | At Risk Signal |
|---|---|---|
Active stakeholder engagement | 20 | Fewer than 3 unique stakeholders at proposal stage |
MAP completion rate | 20 | Under 50% with close date within 45 days |
Viral coefficient | 15 | Zero prospect-to-prospect sharing by mid-cycle |
Time-to-action | 10 | First open beyond 72 hours of DSR send |
Session duration per visit | 10 | Under 5 mins per session mid-funnel |
Content consumption depth | 10 | Pricing viewed; ROI calculator untouched late-cycle |
Video interaction rate | 5 | Under 50% completion on key demo content |
Document download rate | 5 | Zero downloads by proposal stage |
Room-to-close conversion | 5 | Rep conversion rate 50%+ below team average |
Score interpretation:
80–100: Healthy deal. Maintain cadence and prepare close-sequence materials.
60–79: Moderate risk. Address the two lowest-scoring metrics in the next rep conversation.
40–59: At risk. Requires manager involvement in the deal strategy within the week.
Under 40: Critical. Needs a reset conversation, not another follow-up sequence.
The operating cadence that makes this stick

Weekly pipeline reviews should require DSR health scores as mandatory fields for deals above your ACV threshold, composite score, stakeholder count, last meaningful activity, and MAP completion. Deals that can't be scored trigger a coaching conversation, not a favourable pipeline call.
Real-time alerts for high-signal events (new stakeholder joins, contract downloads, viral sharing) should be treated as action triggers within hours, not passive notifications reviewed days later.
Monthly QBRs should segment DSR conversion rates by rep, deal size, and engagement score to distinguish structural process gaps from individual execution problems.
TL;DR
The 9 DSR metrics that predict enterprise deal outcomes: stakeholder engagement, time-to-action, content consumption, document downloads, viral sharing, video completion, MAP progress, session duration, and room-to-close rate.
Reading metrics in isolation misleads. One active stakeholder + strong MAP completion looks healthy; it signals a champion with no internal authority.
Deals with the first DSR engagement within 24 hours close at significantly higher rates than those delayed beyond 72 hours.
Any deal scoring under 55 on the DSR deal health scorecard with a close date inside 45 days is at risk, regardless of what CRM stage shows.
A 34% room-to-close rate can mask a coaching problem: if two reps are closing at 60% while the rest close at 12%, segmenting by rep reveals what aggregate conversion hides.
The three metrics to start tracking if you're currently tracking fewer than four: stakeholder engagement, MAP completion rate, and viral coefficient.
Frequently Asked Questions About DSR Metrics
What are DSR metrics?
DSR metrics are buyer engagement signals captured within a Digital Sales Room, including content views, stakeholder participation, document downloads, and milestone progress. Together, these metrics provide a more accurate view of deal health than CRM stages alone.Which DSR metric is most important?
MAP completion rate is one of the strongest indicators of deal success because it measures mutual commitment between buyers and sellers. Consistently missed milestones often signal risks before they appear in traditional pipeline reports.How often should DSR metrics be reviewed?
Review DSR metrics weekly for active opportunities, especially high-value deals. Real-time alerts for events like new stakeholder activity or document engagement help teams act quickly when buyer intent changes.What is a good room-to-close conversion rate?
The best benchmark is your own historical performance. Comparing DSR-enabled deals against non-DSR opportunities reveals the true impact of digital sales rooms on conversion rates.How do DSR metrics improve sales forecasting?
DSR metrics enhance forecasting by validating pipeline stages with actual buyer behavior. Stakeholder engagement, content interaction, and milestone completion provide stronger indicators of deal momentum and risk.What is a viral coefficient in DSR metrics?
The viral coefficient measures how often prospects invite additional stakeholders into the Digital Sales Room. Higher rates of internal sharing often indicate stronger buying committee engagement and active champion support.Can DSR metrics replace CRM reporting?
No. CRM reporting tracks deal progression through the sales process, while DSR metrics reveal buyer engagement and deal quality. The most accurate forecasts combine both perspectives.
You may also like

A Guide to Project Management Professional Certification

Laugh Your Way to Productivity: 50 Workplace Quotes

50 Funny Workplace Memes That’ll Brighten Your Workday.

What Does a Customer-First Mindset Mean? Explained in 2025

What It Takes to be a Great Customer Success Manager in 2025

